Grafana MCP Server: Secure Setup for Claude & AI Agents (2026)
The Grafana MCP server lets Claude, Cursor, and AI agents query dashboards, logs, and metrics in plain English. Here's the setup, the real risk of PII and secrets hidden in observability data, and how to govern it with redaction at the MCP layer.
The Grafana MCP server lets AI agents (Claude, Cursor, ChatGPT, custom agents) query dashboards, logs, and metrics through the Model Context Protocol — searching dashboards, listing datasources, and running queries against Prometheus, Loki, CloudWatch, Snowflake, and more.
The official server, maintained by Grafana Labs, is read/write by default with a --disable-write flag for read-only. It authenticates with a service-account token and can also create and modify alerts, incidents, and dashboards.
The exposure is the part nobody classifies: observability data. Log lines routinely contain PII — user emails, IP addresses — and accidentally-logged secrets like tokens and keys. And because Grafana queries other datasources, one MCP connection becomes a pivot into Prometheus, Loki, CloudWatch, and even Snowflake.
Strac Grafana MCP DLP is the governance layer for AI-agent access to Grafana. Strac sees every query, controls which datasources an agent can reach and whether it can modify dashboards or alerts, protects log and query content with redaction, masking, and custom regex, and proves every call as audit evidence mapped to SOC 2 / HIPAA / PCI / GDPR. Redaction is part of it, not the whole of it.
Setup is agentless and under 10 minutes — no application changes.
What Is the Grafana MCP Server?
The Grafana MCP server is a Model Context Protocol implementation that exposes a Grafana instance to AI agents as standardized tools — searching and reading dashboards, listing and querying datasources, running log and metric queries, and managing alerts and incidents.
The official mcp-grafana, maintained by Grafana Labs (Apache 2.0, written in Go), works against both self-hosted Grafana and Grafana Cloud. It's read/write by default, with a --disable-write flag that restricts it to read access while preserving querying. It authenticates with a service-account token and supports multi-organization access. Tool categories are configurable, and RBAC requirements are documented per tool.
The crucial thing to understand: Grafana is not itself the data store — it's a window onto your datasources. So the Grafana MCP server queries through Grafana into Prometheus, Loki, ClickHouse, CloudWatch, Elasticsearch, and Snowflake. One connection reaches many backends.
From the on-call engineer's seat, the agent suddenly understands the observability stack — it pulls logs, correlates metrics, and explains an incident. From the security seat, you've handed an AI client a query path into logs full of PII and secrets, and a pivot into every connected datasource.
That's the value. It's also exactly where a control layer belongs.
What AI Agents Can Actually Do With Grafana MCP
Point an agent at the Grafana MCP server and it works the observability stack directly, bounded by the service-account token. In practice it can:
Query logs in plain English — run Loki queries that return raw log lines, including whatever PII and secrets those lines contain.
Query metrics and datasources — execute Prometheus, CloudWatch, Elasticsearch, and Snowflake queries through Grafana's datasource proxy.
Search and read dashboards — find dashboards and read their panels, queries, and rendered output.
Manage alerts and incidents — on the default read/write configuration, create and modify alert rules and incidents.
Render and snapshot — produce dashboard PNGs and snapshots for sharing.
Every one of those runs with the service-account token's permissions — which is what makes it useful, and exactly why the data those queries return needs an inspection layer in the tool-call path.
The Real Security Risks of the Grafana MCP Server
Observability data is sensitive data that no one labels as such. Five categories every security team should price in:
1. Logs are full of unclassified PII. Application and access logs routinely contain user emails, IP addresses, request bodies, and identifiers — PII that flows into Loki and is one query away from the model context, even though nobody ever classified it as regulated.
2. Secrets leak into logs. Tokens, API keys, and connection strings get logged accidentally all the time. A Loki query through the MCP server can surface those secrets straight into an AI agent.
3. Grafana is a pivot into every datasource. Because Grafana proxies queries to Prometheus, CloudWatch, Elasticsearch, and Snowflake, the MCP server's reach isn't limited to Grafana — it extends into the regulated data living in those backends. One connection, many blast radii.
4. Read/write means an agent can change alerting. The server is read/write by default; a prompt-injected agent could modify or disable alert rules — turning a monitoring tool into a way to create a security blind spot, not just read data.
5. Service-account tokens are broad. A Grafana service-account token can carry wide permissions across orgs and datasources. The --disable-write flag and per-tool RBAC are opt-in controls, not the default posture.
Grafana's own controls — RBAC, --disable-write, scoped service accounts — are all about access; none redact the PII and secrets inside the log lines an allowed agent queries. The DLP a company already runs doesn't sit between an agent and Grafana's datasource proxy. That reach is precisely why each agent's access must be governed: controlled (which datasources it can reach, and whether it can modify dashboards or alerts), the sensitive data it returns protected, and every query audited. That is where Strac Grafana MCP DLP lives.
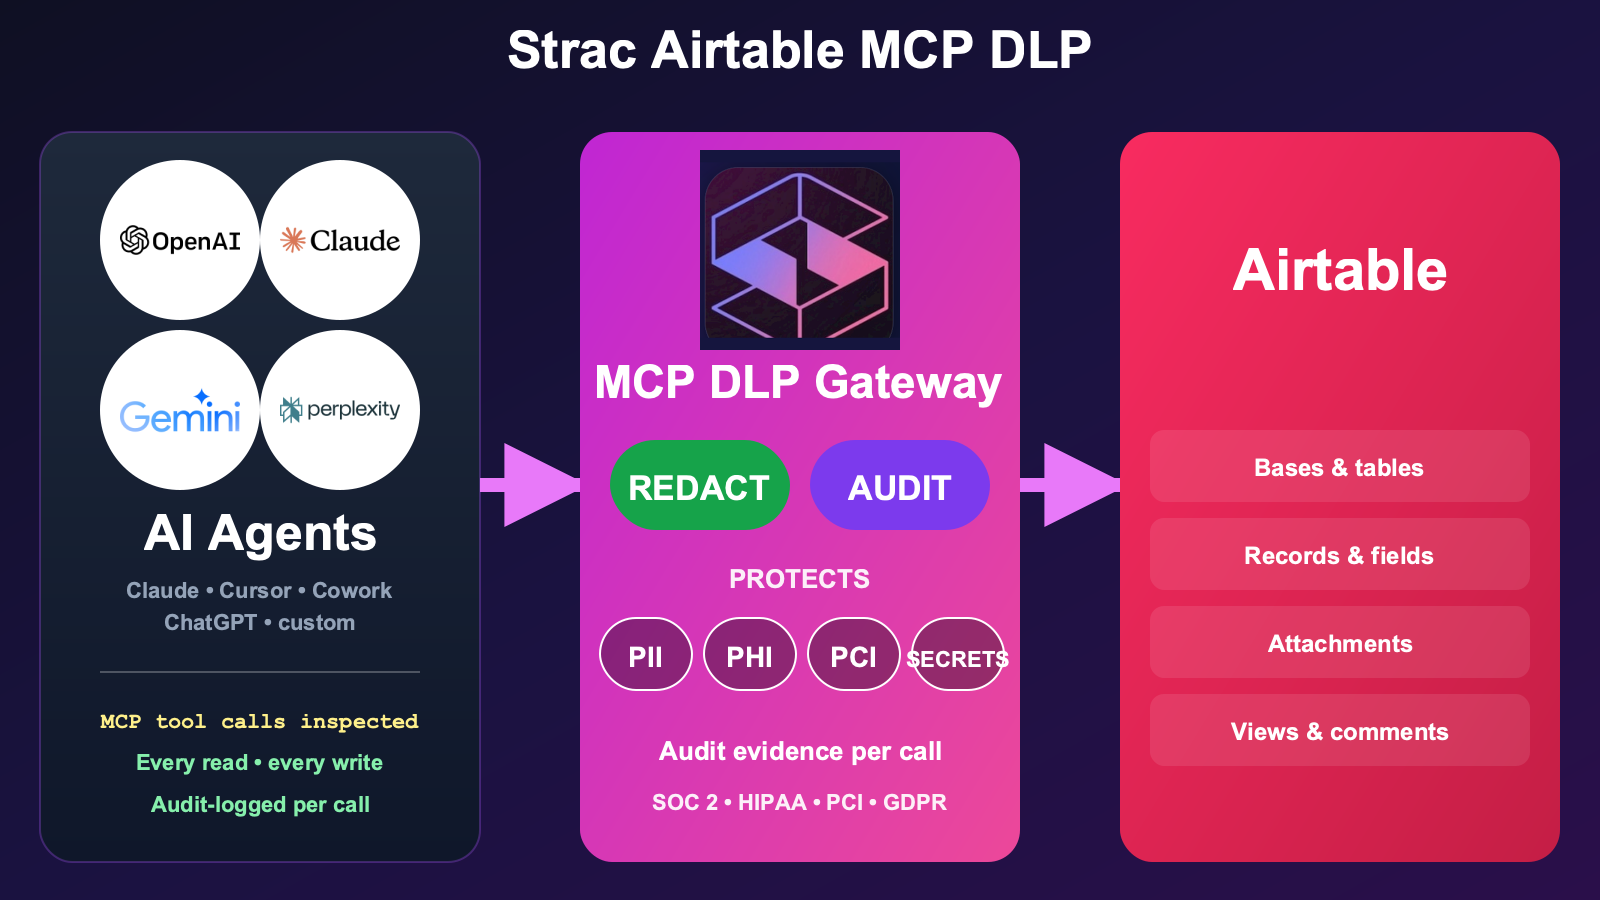
Strac's Grafana MCP DLP is the governance layer that sits between AI agents and the Grafana MCP server. Strac governs every query: it sees exactly what each agent runs, controls what it can reach and do, protects the log and query content it touches, and logs every call as audit evidence. In-policy, non-sensitive queries flow through untouched.
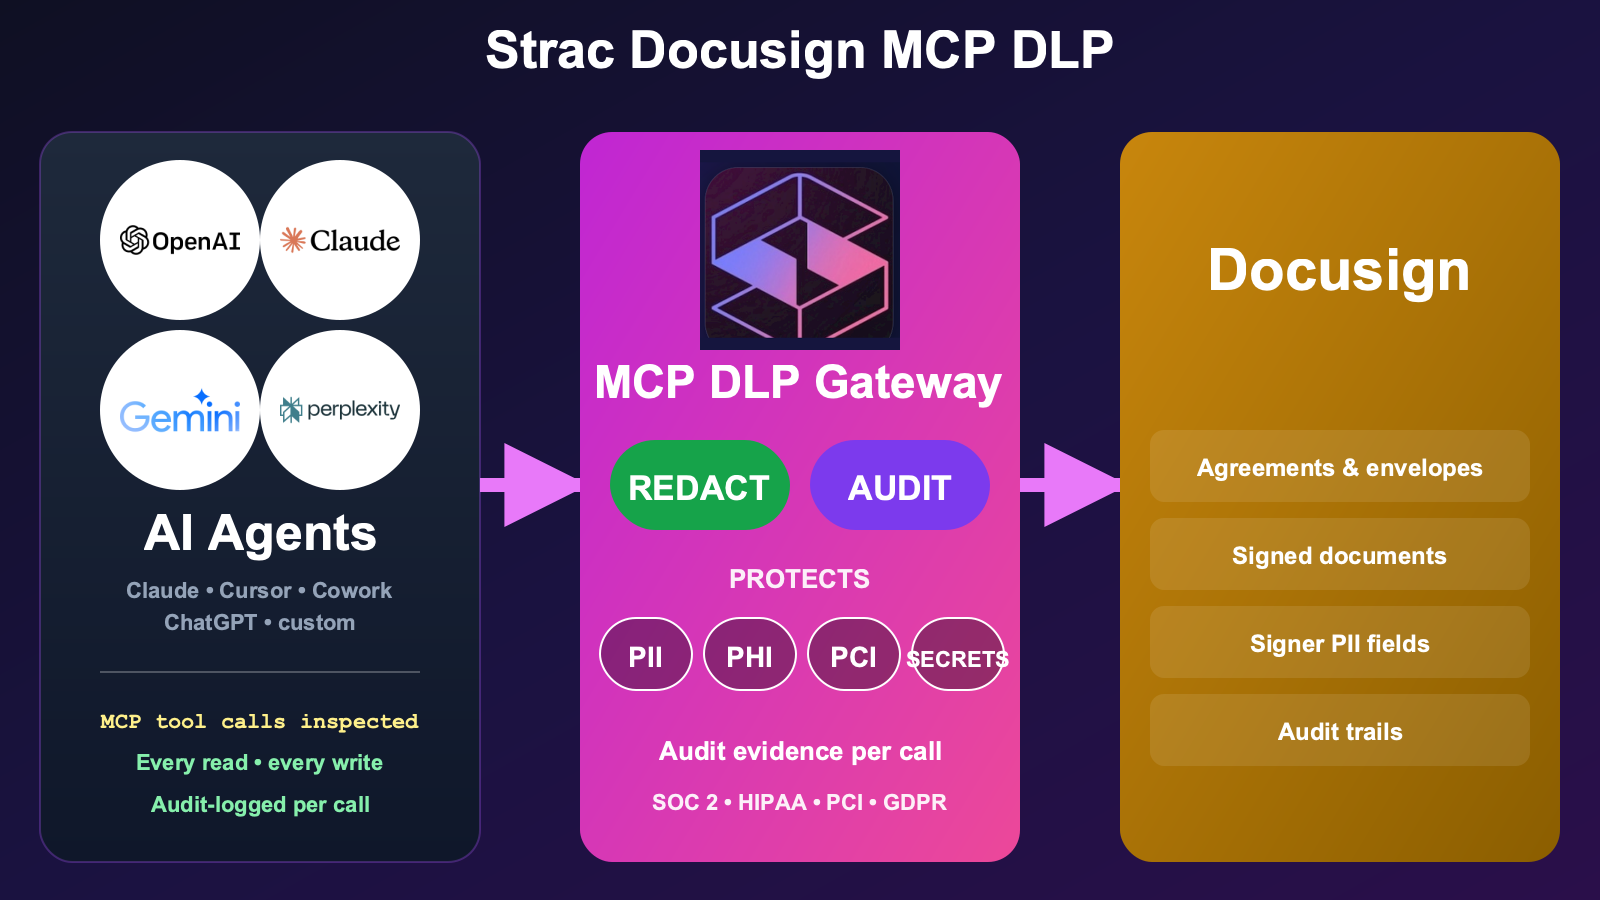
The Strac Grafana MCP DLP gateway sits between any AI agent (Claude, Cursor, ChatGPT, custom) and the Grafana MCP server. It scopes which datasources the agent can reach, blocks dashboard and alert changes, and redacts PII and secrets from log lines before any result reaches the model.
What this looks like in practice, mapped to See / Control / Protect / Prove:
See — Strac surfaces every query an agent runs: which AI client, which user, which datasources it touched, how many rows or log lines came back, and which data classes were present.
Control — Strac scopes access by datasource and gates writes. You let an agent query logs but never modify alert rules or dashboards — so an injected prompt can't disable monitoring or change a panel.
Protect — and this is exactly the scrubbing gateway the security teams ask about: a managed classifier that finds PII and 48+ secret patterns inside raw log lines and query results, and redacts, masks, or applies your own regex to them before the model sees them — without you standing up a Microsoft Presidio or AWS Bedrock pipeline of your own. The same scrubbing covers the custom MCP tools your team builds on observability data for staff and customers.
Prove — every query is logged with the data classes detected and the controls applied — SOC 2 / HIPAA / PCI / GDPR audit evidence, produced automatically.
The same Strac MCP DLP layer covers the datasources behind Grafana, too — Snowflake MCP, Postgres MCP, and the AWS MCP surface — one control plane across every place AI agents reach your regulated data. See the MCP DLP pillar and the broader MCP data security discipline for the full model.
✨ Strac Data Discovery — Find the PII Hiding in Your Logs
Strac's data discovery surfaces the PII and secrets hiding in your logs and across your data estate — so you know what an agent could expose through Grafana before you ever connect one.
MCP DLP governs the AI-agent surface. Strac's data discovery governs the data itself — continuously finding and classifying PII, PHI, PCI, and secrets across your environment, including the unclassified data that ends up in logs. Most teams run both: discovery to map and label, MCP DLP to govern how agents reach it.
What Strac's discovery includes:
Continuous classification of PII, PHI, PCI, financial data, and credentials across connected data and observability surfaces
Content-level inspection — Strac reads log and query contents, not just field names, so an email or a token in a log line is caught
A live data map that feeds directly into the MCP DLP redaction policy
Audit-ready findings mapped to SOC 2 CC6, HIPAA Security Rule, PCI Req. 3/7/10, and GDPR
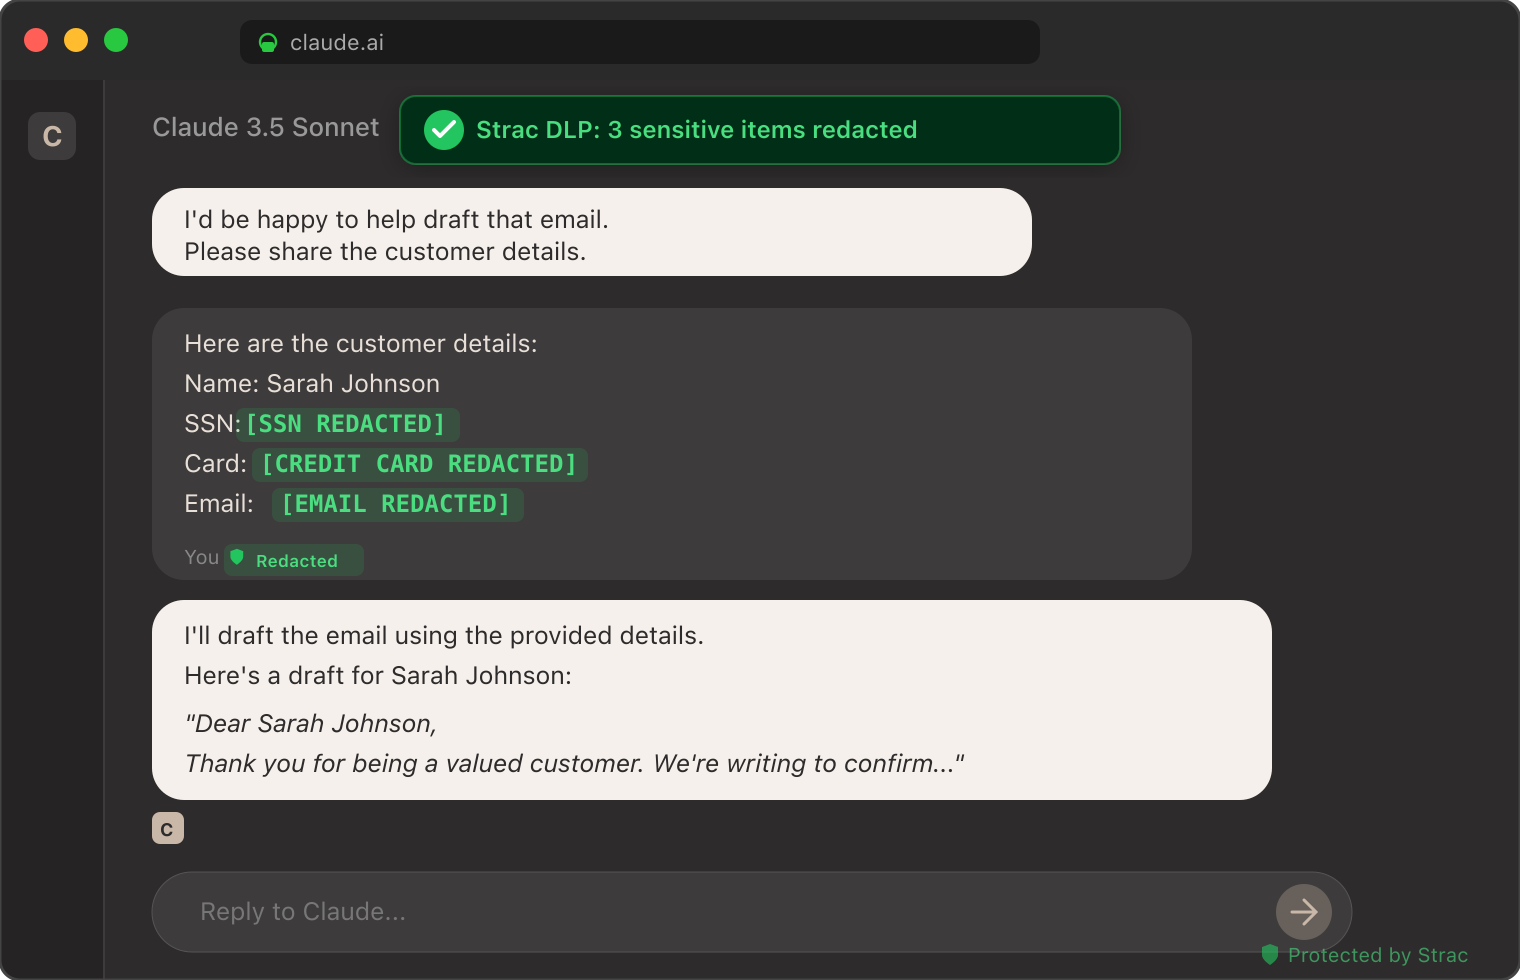
The screenshot below shows Strac's MCP DLP redacting sensitive data from a real Claude session — customer emails, identifiers, and credit card numbers tokenized inline before the model received them. The same inspection pattern runs on every Grafana MCP query routed through Strac, applied to the log lines and query results returned.
Strac DLP at work inside a Claude conversation: sensitive elements tokenized inline before the model sees them. The same pattern runs at the MCP layer for every Grafana log line returned.
How to Set Up Strac Grafana MCP DLP
Setup is agentless and takes under 10 minutes.
Connect Strac to Grafana. Strac uses a dedicated, least-privilege service-account token, scoped to the datasources an agent actually needs — never a broad admin token — and pairs it with read-only enforcement where appropriate.
Point your AI client at the Strac MCP endpoint. Strac issues an MCP server endpoint that drops into your AI client's configuration and proxies to the Grafana MCP server behind it. For Claude Desktop:
json
   "mcpServers": {
     "grafana": {
       "url": "https://mcp.strac.io/grafana",
       "auth": { "type": "bearer", "token": "<your-strac-token>" }
     }
   }
For Cursor, OpenAI Agents, and custom agents — same endpoint, same auth.
Pick your policy. Out-of-the-box templates for SOC 2, HIPAA, PCI, and GDPR. Custom policies — datasource allow/deny, log redaction, dashboard- and alert-change blocking, custom regex for internal identifiers — take minutes to configure.
Done. Every query between your agent and Grafana now flows through the Strac gateway. The audit log starts populating immediately.
Compliance Coverage Out of the Box
The same Strac Grafana MCP DLP control produces evidence mapped to every major compliance framework.
Framework
What Strac Grafana MCP DLP Satisfies
SOC 2
CC6.1 (logical access to data), CC6.6 (unauthorized data exposure), CC6.7 (restricted transmission of data to external systems), CC7.2 (monitoring for anomalies including AI query activity)
Req. 3.3 (PAN masking), Req. 3.4 (render PAN unreadable), Req. 7 (least privilege), Req. 10 (log every access to cardholder data)
GDPR
Art. 5 (data minimization & purpose limitation), Art. 25 (data protection by design), Art. 30 (records of processing), Art. 32 (security of processing)
For the broader AI-data-governance program this sits inside, see AI DLP.
🌶️ Spicy FAQs for Grafana MCP Server
Is there an official Grafana MCP server?
Yes — Grafana Labs maintains the official mcp-grafana server (Apache 2.0, written in Go), which works with self-hosted Grafana and Grafana Cloud. It covers dashboards, datasource queries, alerts, incidents, and OnCall, and authenticates with a service-account token. It's read/write by default, with a --disable-write flag for read-only.
Is the Grafana MCP server read-only?
Not by default — it's read/write, with a --disable-write flag you can set to restrict it to read access (disabling dashboard, alert, incident, and snapshot changes while keeping queries). Even in read-only mode, it still returns raw log lines and query results, so scoping prevents writes but doesn't redact the PII and secrets inside the data an agent reads.
Is the Grafana MCP connector the same as the Grafana MCP server?
Yes — the same thing. The MCP specification says server; Claude and Cursor surface it as the Grafana connector. Both let an agent query dashboards, logs, and metrics, and Strac's Grafana MCP connector redacts regulated data at the tool-call boundary regardless of the label.
Why is observability data a risk for AI agents?
Because logs and traces are full of sensitive data that no one classifies. Application logs carry user emails, IPs, and request bodies; secrets like tokens and keys get logged accidentally. A single Loki query through the MCP server can surface all of it into the model. And since Grafana proxies queries into Prometheus, CloudWatch, Elasticsearch, and Snowflake, the exposure extends into those datasources too. The fix is a layer that redacts PII and secrets from log lines and query results before the model sees them.
Can Strac stop an AI agent from modifying Grafana dashboards or alerts?
Yes. Strac inspects the call before it executes. Write actions — creating or modifying dashboards, alert rules, and incidents — can be blocked outright, allowed only on specific resources, or routed for human approval, so an injected prompt can't disable your monitoring.
What sensitive data types does Strac detect in Grafana logs and queries?
PII (SSN, driver's license, passport, address, phone, email, IP addresses), PHI (clinical identifiers), PCI (full and partial card numbers via Luhn check), credentials (API keys, AWS / GCP / Azure access keys, OAuth tokens, JWTs, connection strings — 48+ patterns), and custom detectors — including your own regex — trained on your internal classifications. Detection runs on raw log lines and query results across every connected datasource.
How long does Strac Grafana MCP DLP take to deploy?
Under 10 minutes. Connect Strac with a least-privilege service-account token, paste the Strac MCP endpoint into your AI client's config, pick a policy template, done. No application changes.
The Bottom Line
The Grafana MCP server is fast becoming the way AI agents read your observability stack — dashboards, metrics, and the logs where PII and secrets quietly accumulate. It's read/write by default, and because Grafana proxies into Prometheus, CloudWatch, and Snowflake, one connection reaches far beyond Grafana itself. Running Grafana MCP in 2026 without an MCP-layer governance control isn't a question of if a logged secret reaches a model it shouldn't; it's when.
Strac Grafana MCP DLP gives you the control plane — see every query, scope every agent, block dashboard and alert changes, redact every logged secret and PII, prove every call — so your team can use Grafana with Claude, Cursor, ChatGPT, and any future AI client without making each one a separate security exception.
If you are running — or about to run — Grafana MCP in production, book a 30-minute demo. We'll walk through the architecture, the datasource-scope decision, the log-redaction policy, and a deployment plan for your stack and AI clients.
Yes — Grafana Labs maintains the official mcp-grafana server (Apache 2.0, written in Go), which works with self-hosted Grafana and Grafana Cloud. It covers dashboards, datasource queries, alerts, incidents, and OnCall, and authenticates with a service-account token. It's read/write by default, with a --disable-write flag for read-only.
Is the Grafana MCP server read-only?
Not by default — it's read/write, with a --disable-write flag you can set to restrict it to read access (disabling dashboard, alert, incident, and snapshot changes while keeping queries). Even in read-only mode, it still returns raw log lines and query results, so scoping prevents writes but doesn't redact the PII and secrets inside the data an agent reads.
Is the Grafana MCP connector the same as the Grafana MCP server?
Yes — the same thing. The MCP specification says server; Claude and Cursor surface it as the Grafana connector. Both let an agent query dashboards, logs, and metrics, and Strac's Grafana MCP connector redacts regulated data at the tool-call boundary regardless of the label.
Why is observability data a risk for AI agents?
Because logs and traces are full of sensitive data that no one classifies. Application logs carry user emails, IPs, and request bodies; secrets like tokens and keys get logged accidentally. A single Loki query through the MCP server can surface all of it into the model. And since Grafana proxies queries into Prometheus, CloudWatch, Elasticsearch, and Snowflake, the exposure extends into those datasources too. The fix is a layer that redacts PII and secrets from log lines and query results before the model sees them.
Can Strac stop an AI agent from modifying Grafana dashboards or alerts?
Yes. Strac inspects the call before it executes. Write actions — creating or modifying dashboards, alert rules, and incidents — can be blocked outright, allowed only on specific resources, or routed for human approval, so an injected prompt can't disable your monitoring.
Discover & Protect Data on SaaS, Cloud, Generative AI
Strac provides end-to-end data loss prevention for all SaaS and Cloud apps. Integrate in under 10 minutes and experience the benefits of live DLP scanning, live redaction, and a fortified SaaS environment.

.webp)


.gif)
