November 13, 2026

8
min read
Data Loss Prevention Infographic: A Comprehensive Guide
Discover the importance of data loss prevention infographics and how they can protect your sensitive data.
A data loss prevention infographic is a single visual that explains how your company keeps sensitive data from leaking. It replaces a 20-page policy with icons, short lines, and one flow diagram.
A good one answers four questions, and only four:
People do not reread policies. They do glance at a picture pinned in Slack every week.
The classic infographic warned about phishing, weak passwords, and emailing files home. Those risks remain; they are just no longer the main event.
Today the leak looks different:
An infographic that skips these four is describing last decade's problem. It is also why legacy DLP fails for AI: the tools watch the old exits while data walks out the new ones.
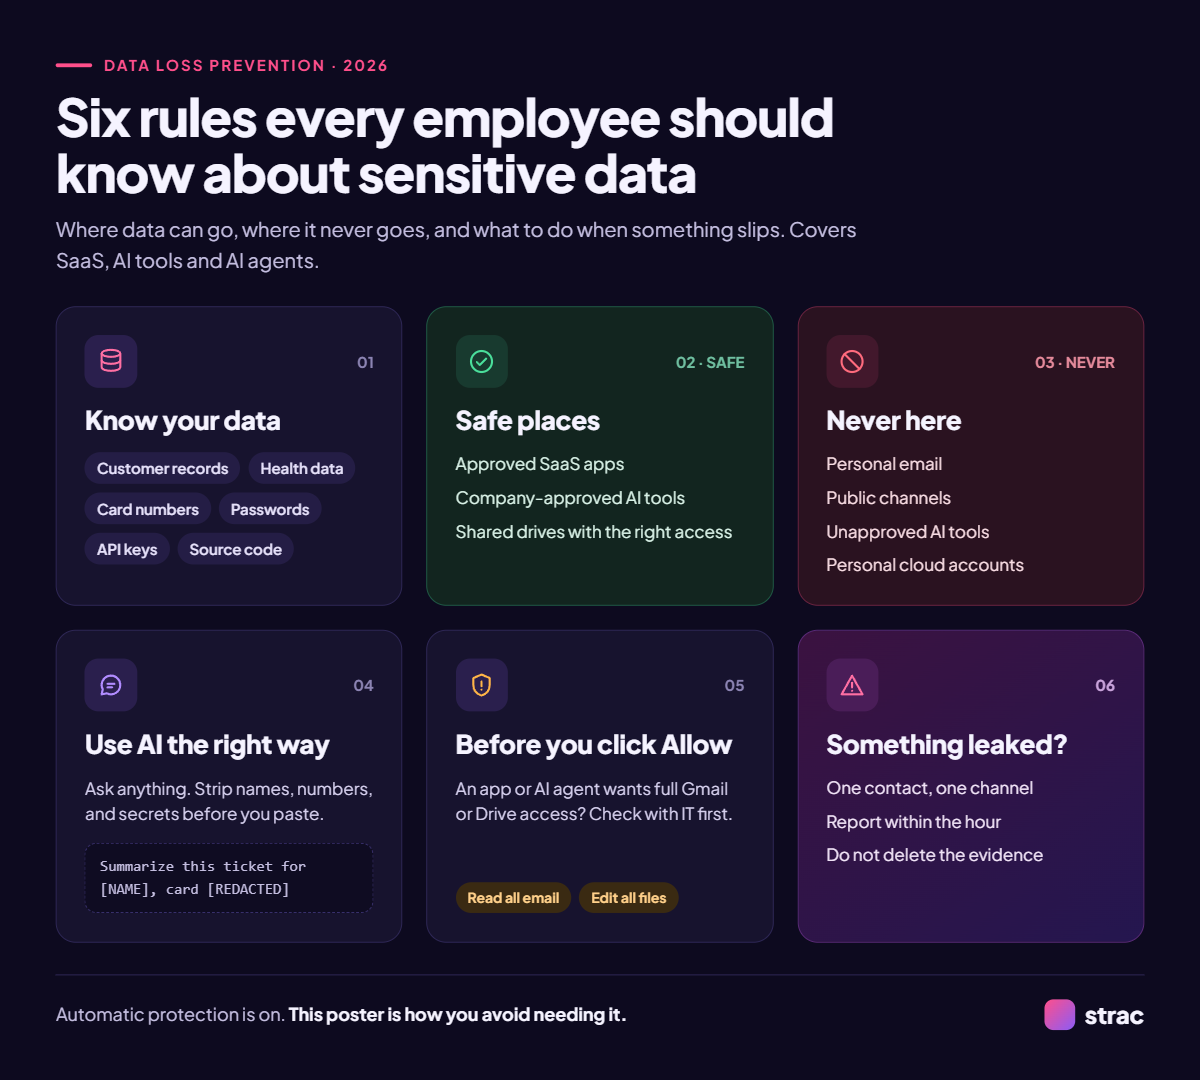
Use this as the outline for your designer. Six panels, one idea each.
Add a footer line: "Automatic protection is on. This poster is how you avoid needing it."
Update it every time your AI tools change. A stale infographic teaches people that the rules are optional.

Every leak follows the same three steps: a person or agent grabs data, sends it somewhere, and the destination keeps it. Training targets the first step. Enforcement has to sit at the second.
That is where data-layer controls work. When an employee pastes a card number into ChatGPT, AI DLP catches it in the browser before submission. When an agent pulls a Slack thread through MCP, MCP DLP redacts the response before the model sees it. The person still gets an answer; the sensitive data never leaves.
An infographic tells people where the line is; Strac holds the line when they forget.
Strac is a DLP, Data Discovery, and DSPM platform that turns each panel of your infographic into a live control.
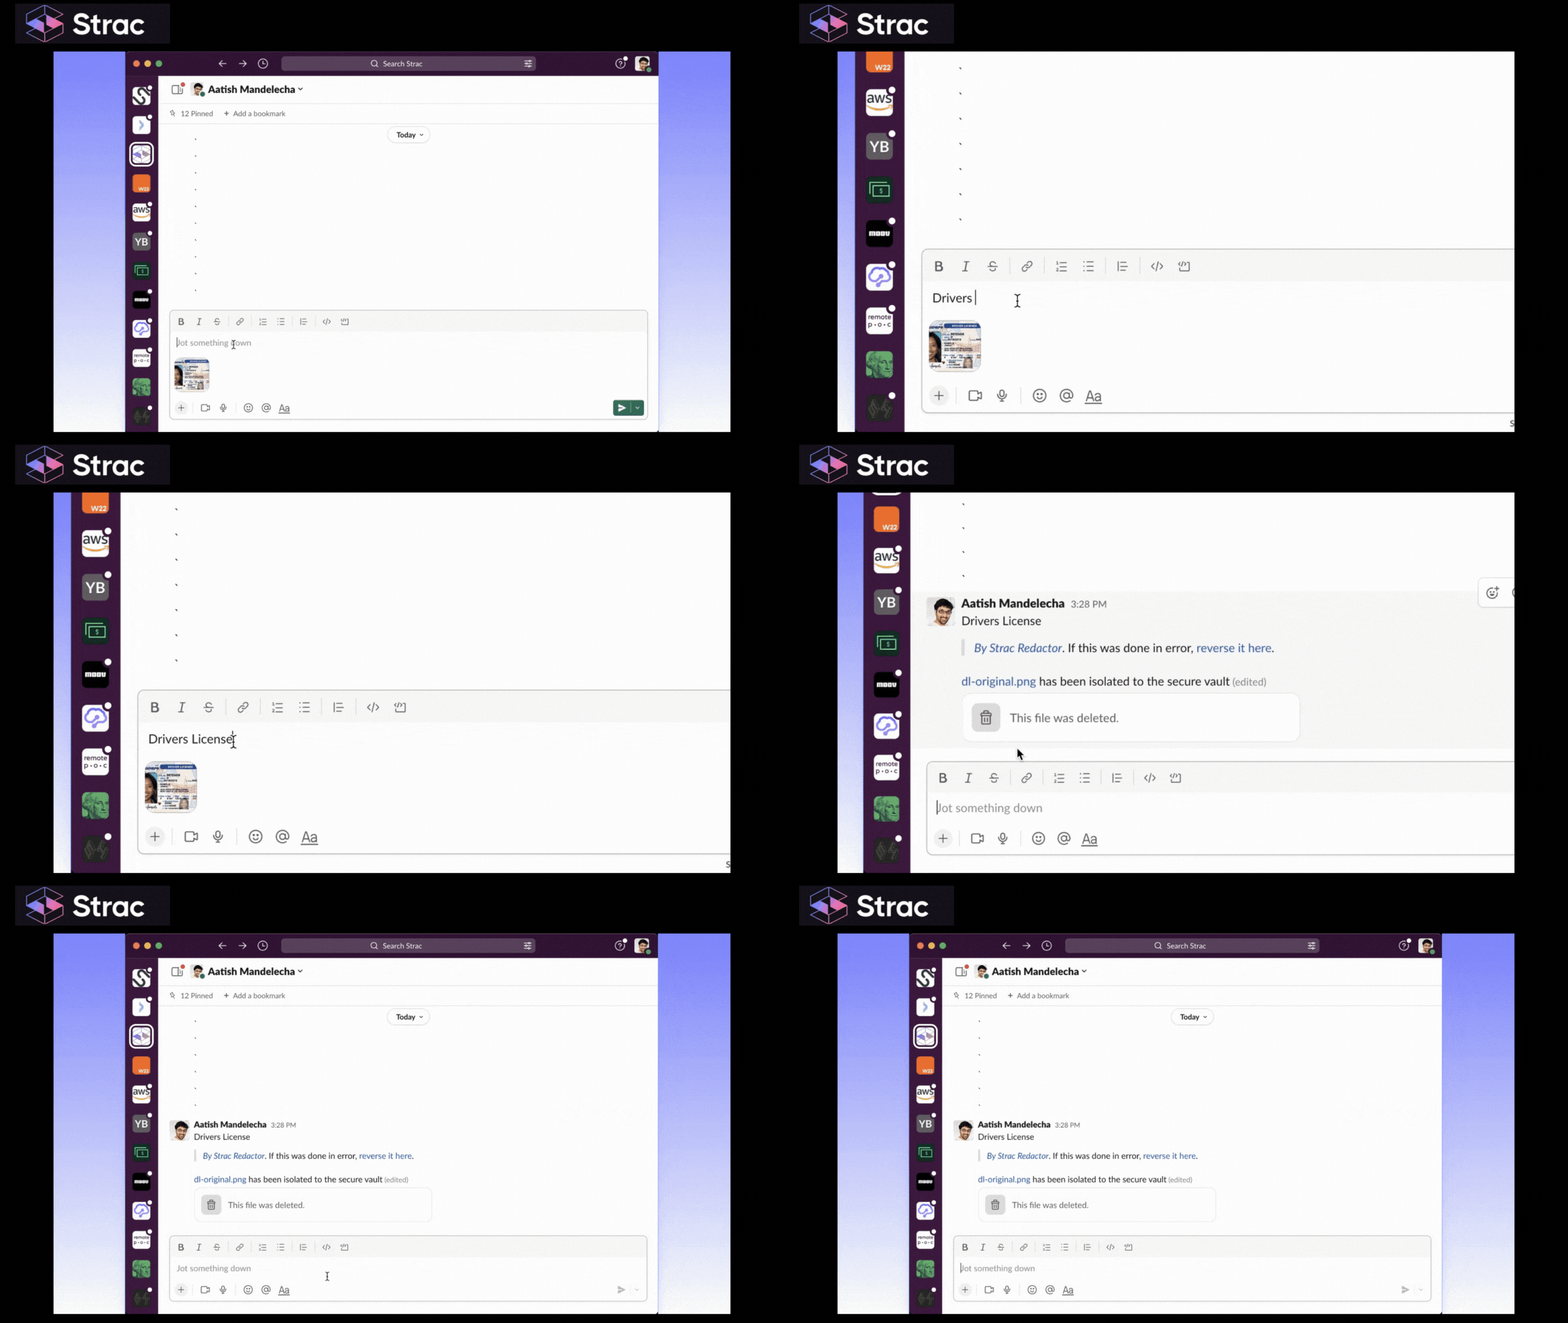
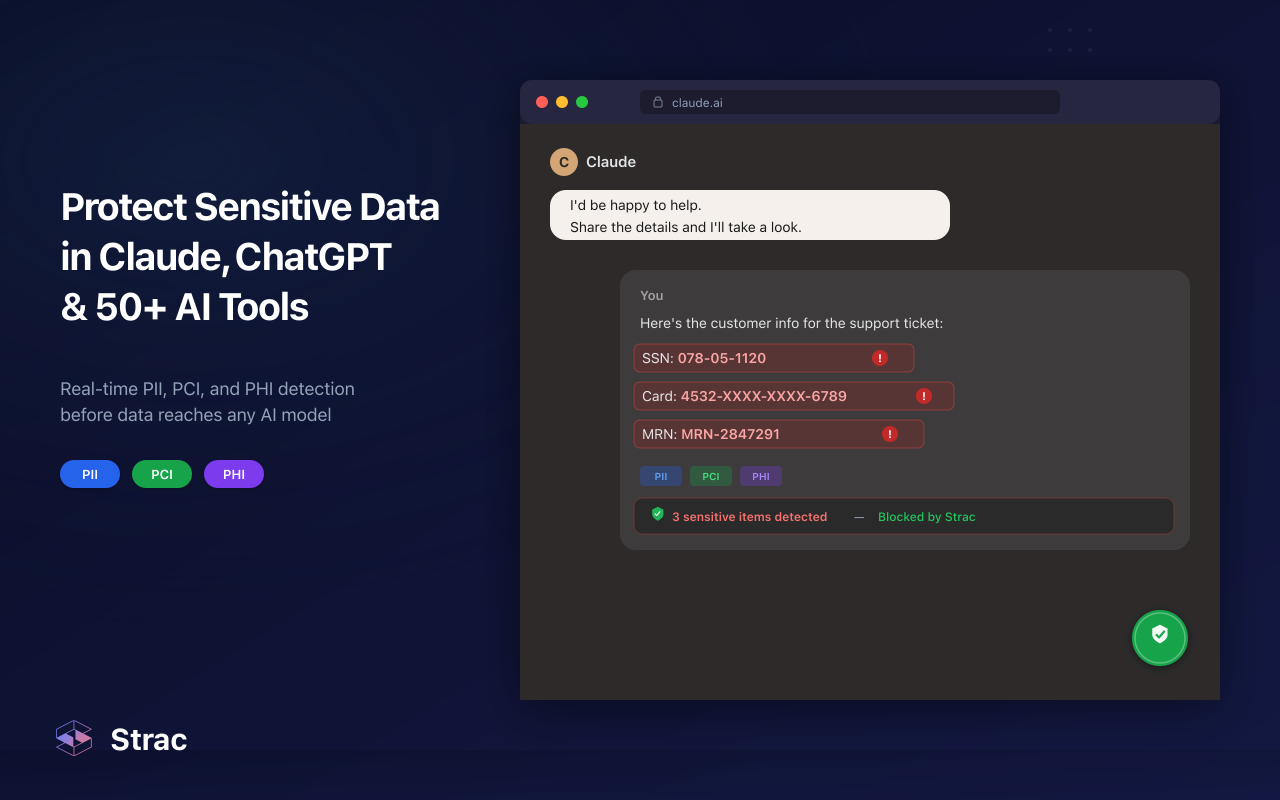
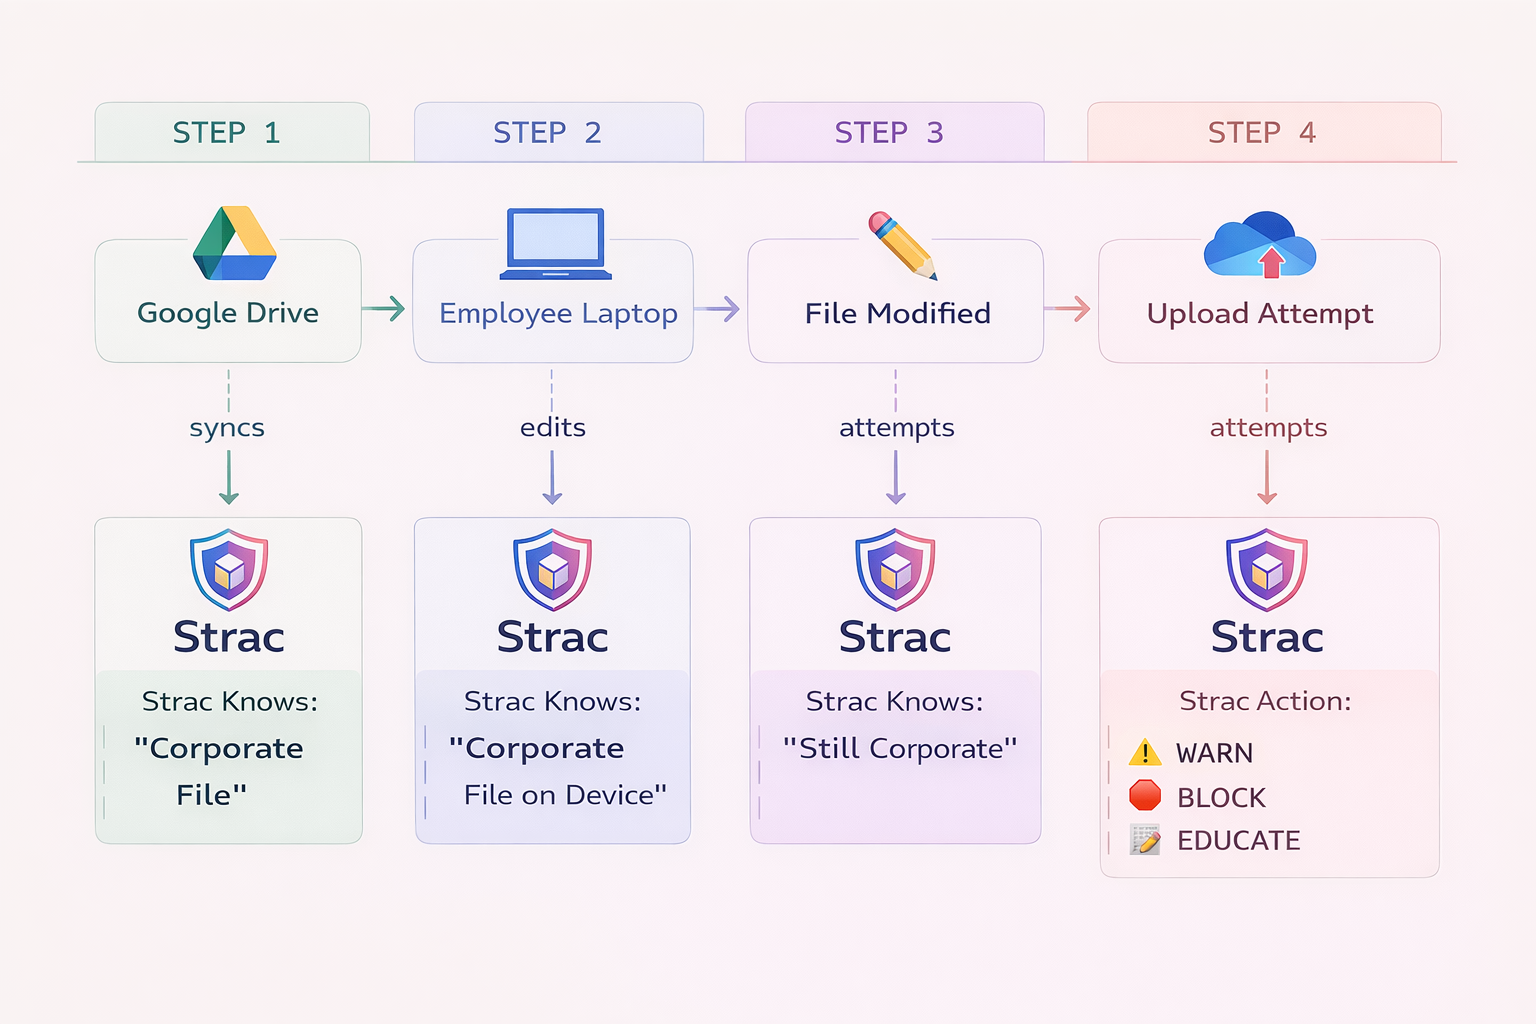
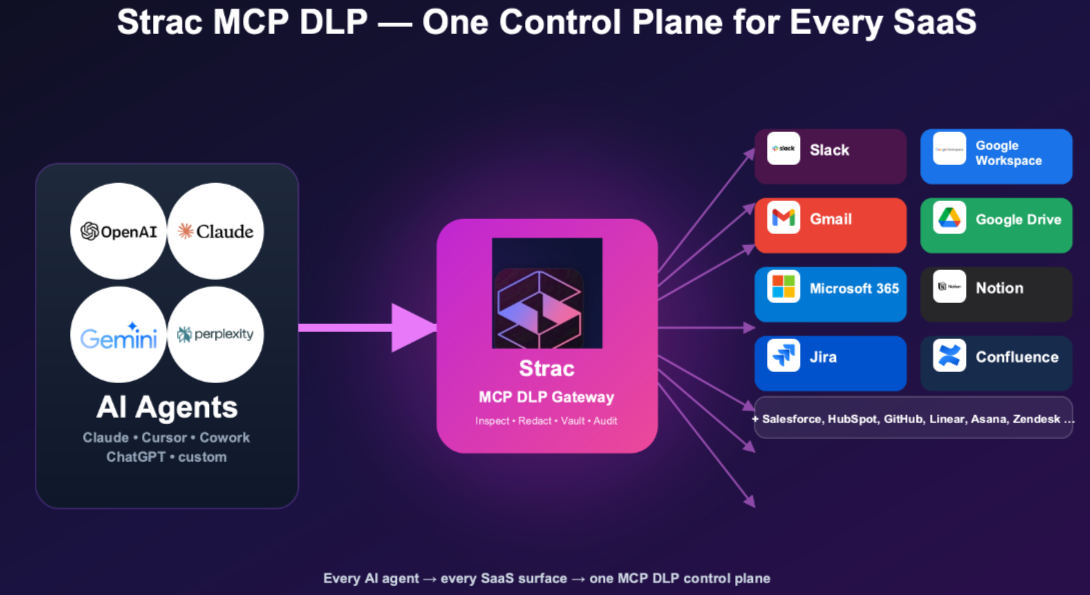
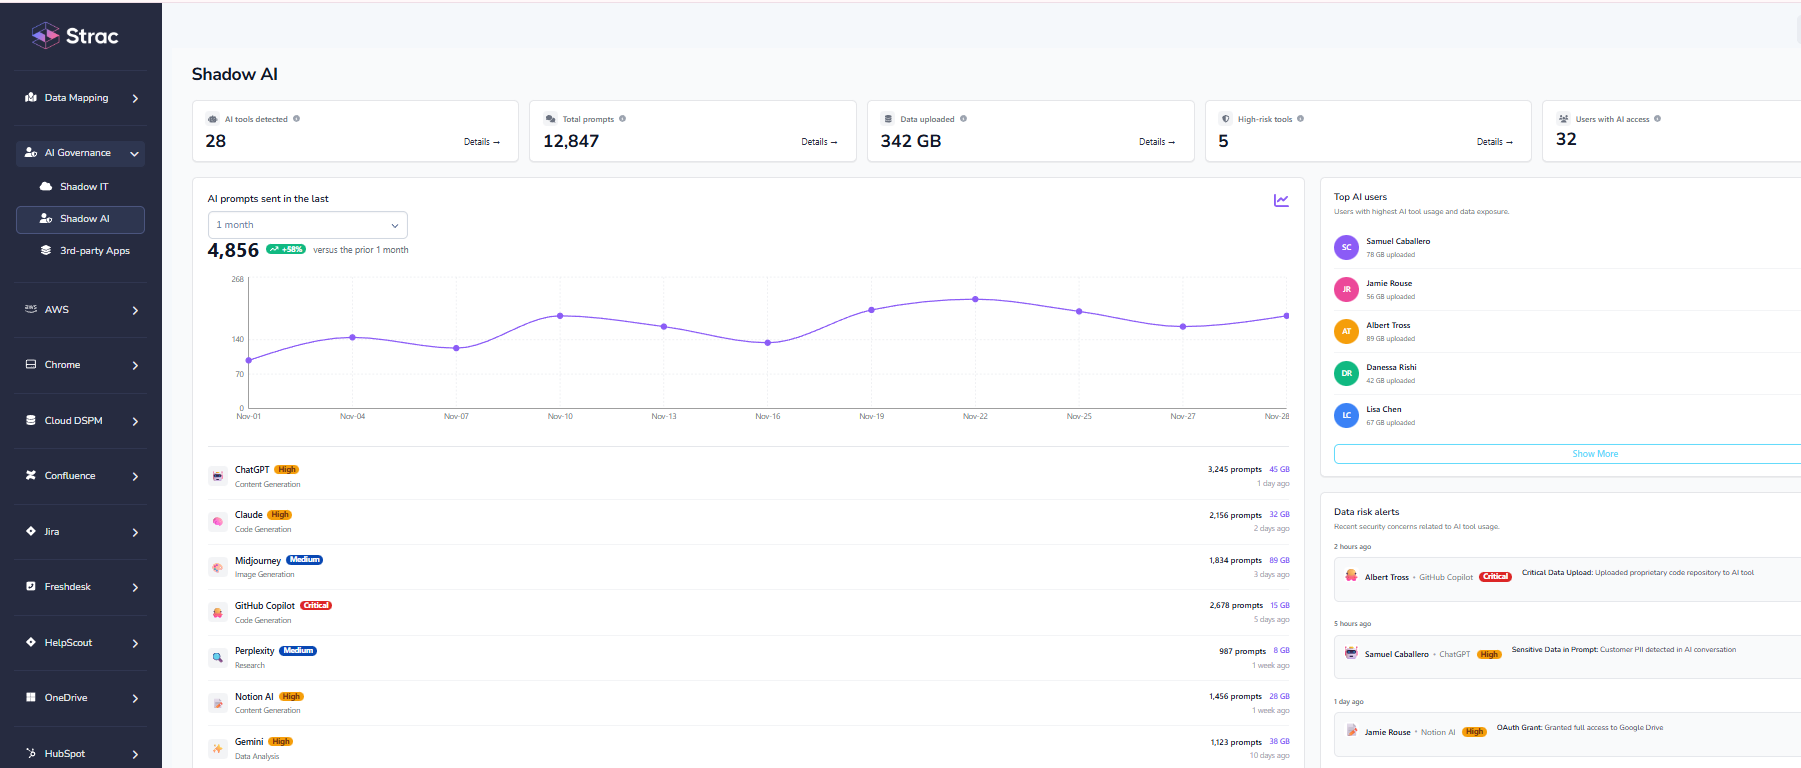
When Strac finds sensitive data, it acts in this order:
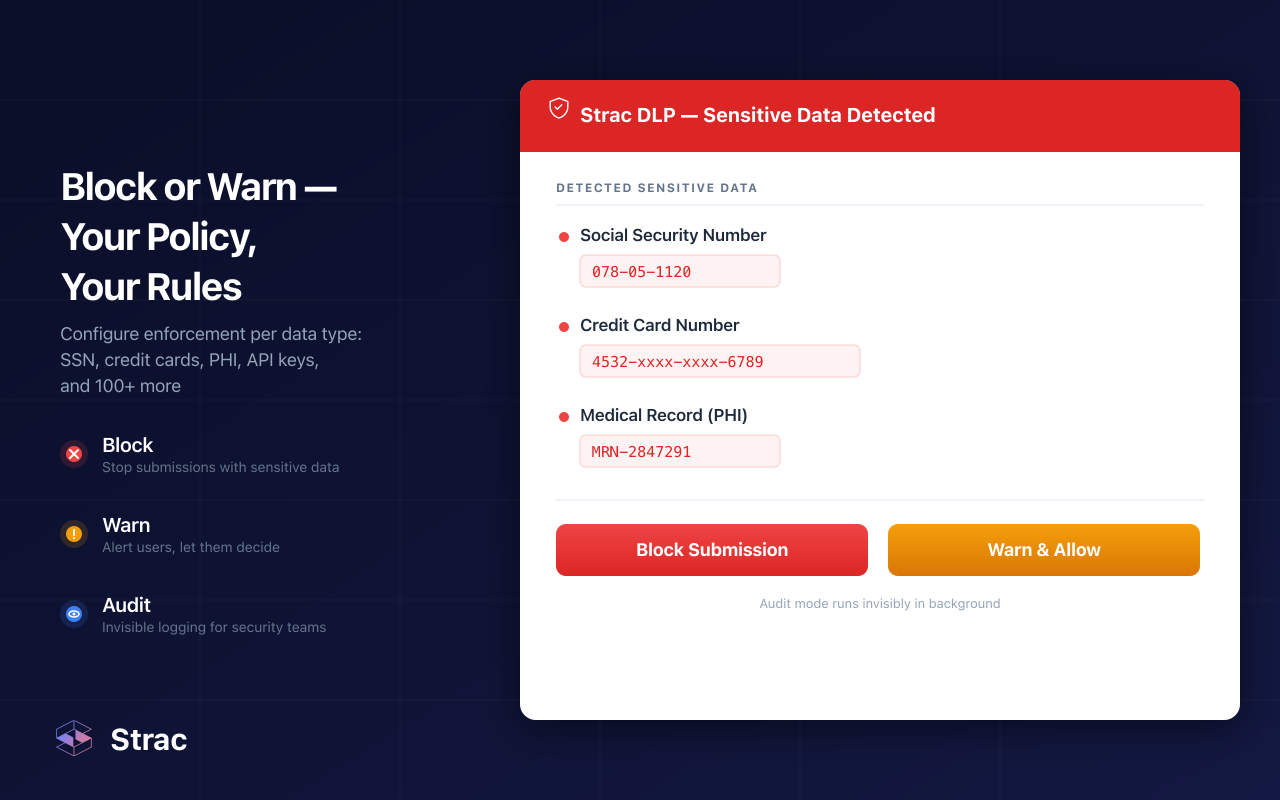
Policies map to SOC 2, HIPAA, PCI DSS, ISO 27001, GDPR, ISO 42001, and the EU AI Act, so the controls double as audit evidence. SaaS integrations connect through APIs in under 10 minutes.
Training changes habits. Redaction changes outcomes. You need both.
An infographic teaches people where sensitive data may go. In 2026, that data also moves through AI prompts, desktop apps, and MCP agents that no poster reaches. Training, identity, and model controls all fail eventually, so the data layer is the backstop: redact on every action and a mistake never becomes a breach.
No. A policy is the legal record; an infographic is the habit. The policy lists what is prohibited across 20 pages. The infographic shows the six rules people actually remember right before they paste a customer list into a chatbot.
Because training fades by Thursday. People under deadline pressure skip what they learned. DLP catches the paste, the upload, and the agent call in the moment, so one tired click does not turn into a reportable breach.
Not if the default is redaction, not blocking. Strac strips the card number or SSN and lets the message, prompt, or agent request go through. People keep working with AI tools; only the sensitive fragment stays home.
Not on its own. It lowers the number of mistakes, but it cannot catch the ones that still happen, and AI agents never read posters. That is why the data layer has to back it up.
It is the human-facing layer of AI data governance. The infographic sets expectations, DLP enforces them, and audit logs prove both. See AI governance frameworks and the AI data governance pillar for the full picture.
“Don’t just alert on problems, fix them.”
Scott Roberts, Chief Information Security Officer, UiPath









Customers include